Introduction
Display Weather Hazards: EDR Turbulence, Icing Forecast, and EDR Thunderstorm Forecast
In this topic, you learn how to add information about weather hazards such as turbulence, icing, and thunderstorms to the map. You also learn how to interpret that information.
We estimate that this will take 10 minutes to complete.
Detailed explanation
Weather Hazards
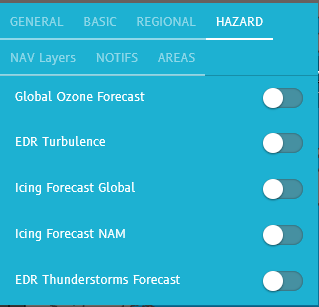
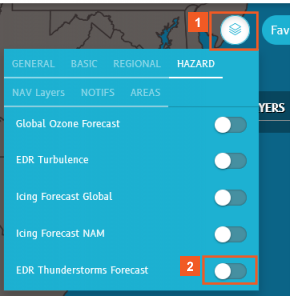
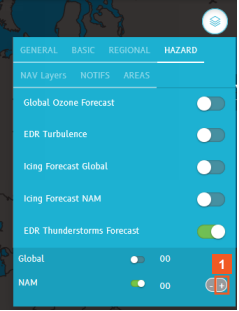
Display flight hazards using the information provided in the HAZARD tab to optimize flight routes or improve flight decisions based on those hazards. The options include:
- Global Ozone Forecast: forecasting position and the concentration of the ozone layer
- For more details on working with the Global Ozone Forecast layer, consult the topic, Display Weather Hazards: Global Ozone Forecast.
- EDR Turbulence: turbulence at multiple flight levels as well as forecast periods globally or for the North American Mesoscale Model (NAM).
- Icing Forecast (Global and NAM): forecasts for icing for different aircraft sizes, flight levels, as well as forecast periods over North America or globally.
- EDR Thunderstorms Forecast: forecast convective activity and intensity for different forecast periods globally or for North America.
HINT
The HAZARD tab is available only if you subscribe for weather information for at least one region.
*Aircraft sizes refer to three categories of aircraft (small, medium, and large) determined by our weather data provider (DTN) according to the aircraft percent power increase (PPI). PPI is the minimum thrust power increase required to maintain the speed and altitude after a five-minute exposure to the icing conditions. These aircraft sizes do not match the ICAO light/medium/heavy categories.
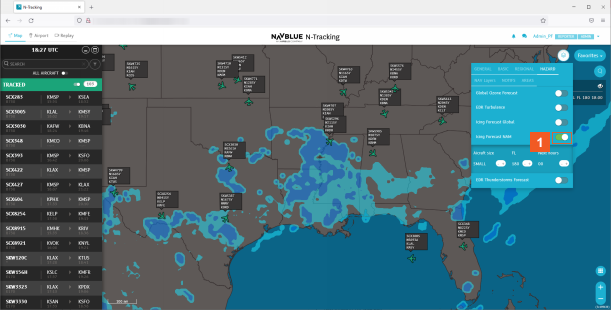
Let's get oriented: Start with the map focused on the United States, at a zoom level of 200 nm. Then, explore applying and interpreting turbulence, icing, and thunderstorm forecast information.
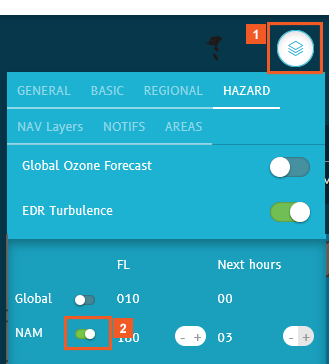
As with the other weather information, use the Layers button to access the weather HAZARD layer.
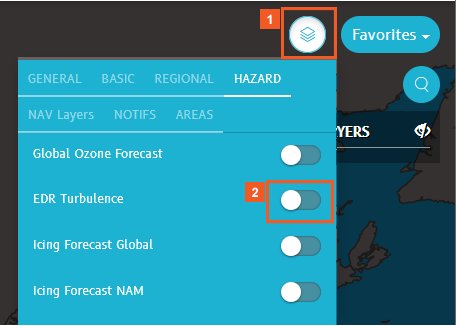
![]() Click the Layers button.
Click the Layers button.
EDR (Eddy Dissipation Rate) is a universal and aircraft-independent measure of turbulence based on the rate at which energy dissipates in the atmosphere.
Use the EDR Turbulence layer to depict turbulence data on the map either globally, or for North America only.
The NAM forecast updates hourly and the global forecast updates every 12 hours.
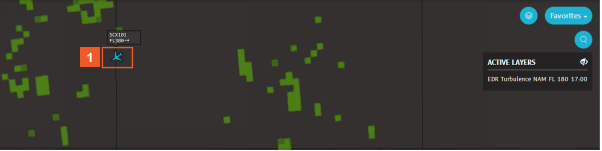
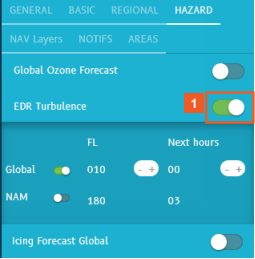
![]() Click the EDR Turbulence slider.
Click the EDR Turbulence slider.
Let's see what turbulence over the U.S. looks like at FL 180.
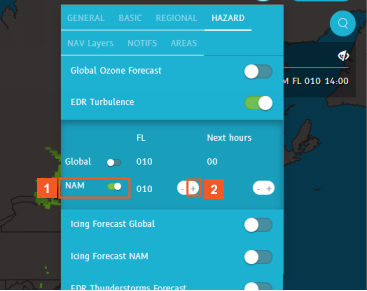
![]() Click the NAM slider.
Click the NAM slider.
Choose the applicable flight level or forecast period using the offset controls ![]() .
.
![]() Click the NAM FL + button.
Click the NAM FL + button.
Interpret the colors that depict turbulence using this legend: The legend also shows the EDR level at which different weights of aircraft will experience turbulence as light, moderate, severe or extremely severe.
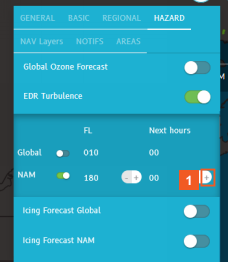
![]() Click the NAM Next hours + (plus) button.
Click the NAM Next hours + (plus) button.
Zoom in (to 50 nm) to look in more detail at the areas of turbulence.
![]() Click the Zoom in (+) button.
Click the Zoom in (+) button.
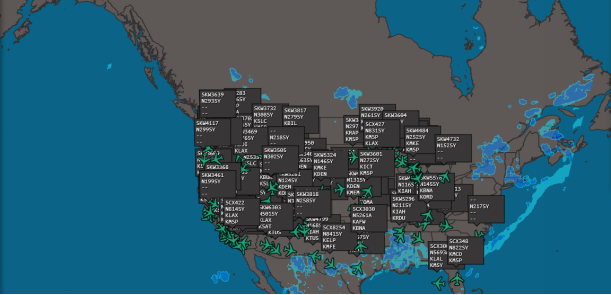
You can now see turbulence for NAM FL180 forecast for the next three hours.
Let's see if the forecast turbulence has any serious impact on the flights you're tracking: Display the Flight Plan for SCX101 on the map.
![]() Click the SCX101 aircraft icon.
Click the SCX101 aircraft icon.
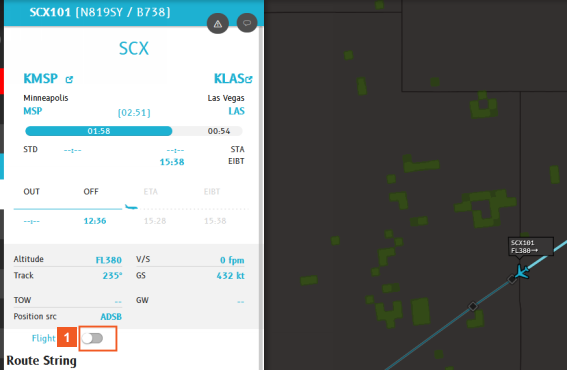
![]() Click the Flight Plan slider.
Click the Flight Plan slider.
Close the Flight details pane by clicking anywhere on the map.
![]() Click anywhere on the map.
Click anywhere on the map.
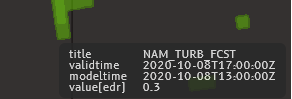
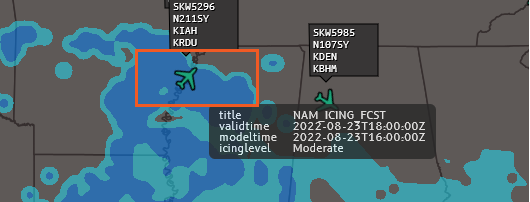
Hover over the green area on the flight path of flight SCX101. N-Tracking displays information about forecast turbulence.
Multiply the value by 100 to determine the EDR.
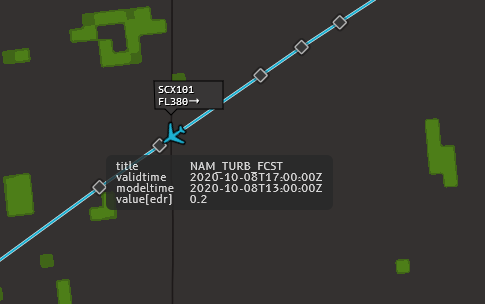
Notice that several of the colored areas use two different shades of green to depict different levels of turbulence. As with other Weather Layers, you can hover over the different colors to learn what each means.
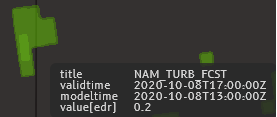
The lighter green area shows a value of 0.3 for the forecast turbulence.
Zoom out again to see more of the map.
![]() Click the Zoom out (-) button.
Click the Zoom out (-) button.
Access the display of global turbulence information.
![]() Click the Layers button.
Click the Layers button.
Disable the NAM turbulence layer.
![]() Click the NAM slider.
Click the NAM slider.
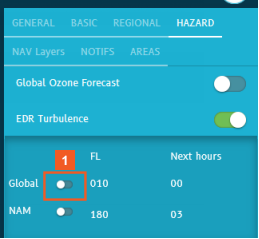
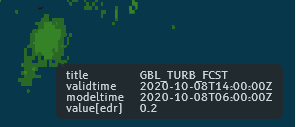
![]() Click the Global slider.
Click the Global slider.
Hovering over any of the green-shaded areas displays details about the forecast turbulence.
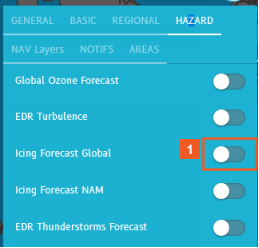
Your review of working with turbulence information is complete. Disable the EDR Turbulence layer.
![]() Click the EDR Turbulence slider.
Click the EDR Turbulence slider.
Next, explore how to view and interpret icing forecast information on the map.
You can use the same flight level and time offset controls on the Global and NAM (North America) Icing Forecast layers that you used on other weather information layers.
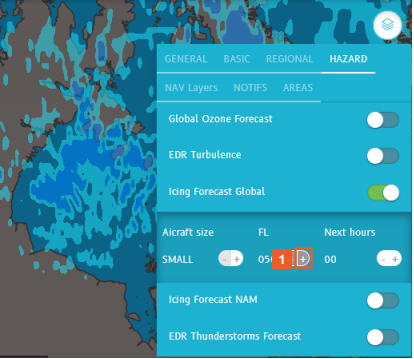
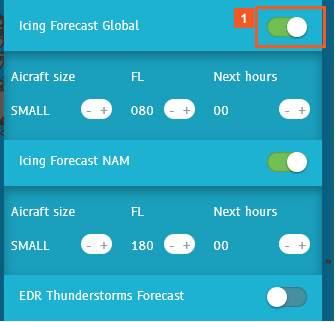
![]() Click the Icing Forecast Global slider.
Click the Icing Forecast Global slider.
In this example, at flight level 050, for small aircraft, you see forecast icing conditions in and around Hudson Bay (Canada).
The colors used to depict icing conditions are as follows:
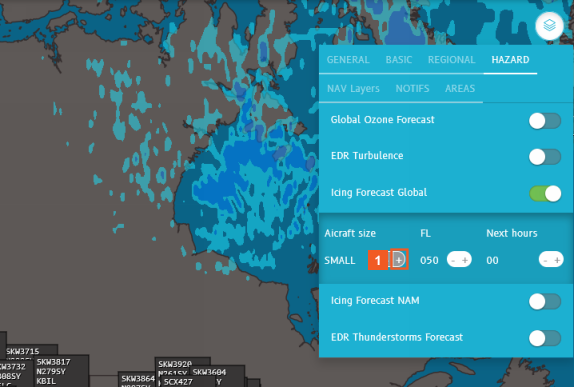
To see icing conditions that apply to larger aircraft, use the Aircraft size offset control (+) to cycle first to MEDIUM, and then to LARGE.
![]() Click the Aircraft size + button.
Click the Aircraft size + button.
At this time, there is less forecast icing, and it has a less severe impact for large aircraft.
For the rest of this example, switch the aircraft size back to SMALL.
![]() Click the Aircraft size - button.
Click the Aircraft size - button.
REMINDER
Aircraft sizes refer to three categories of aircraft (small, medium, and large) determined by our weather data provider (DTN) according to the aircraft Percent Power Increase (PPI). PPI is the minimum thrust power increase required to maintain the speed and altitude after a five-minute exposure to the icing conditions. These aircraft sizes do not match the ICAO light/medium/heavy categories.
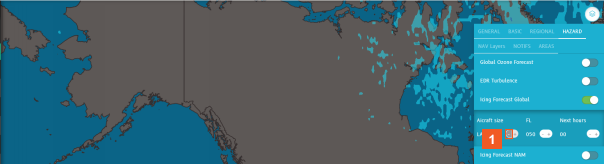
Next, change the flight level to 080 and see how forecast icing conditions change at that level.
![]() Click the FL + button.
Click the FL + button.
![]() Click the Zoom (+) button.
Click the Zoom (+) button.
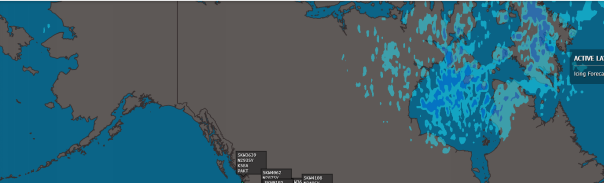
In this example, you see more forecast icing at 80,000 ft around Alaska and less in and around Hudson Bay.
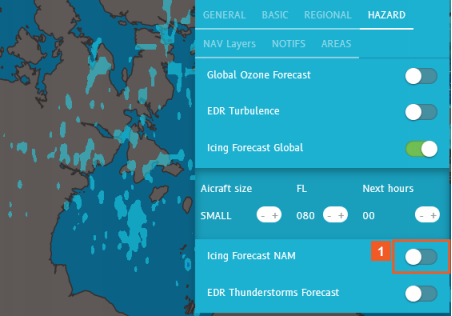
![]() Click the Icing Forecast NAM slider.
Click the Icing Forecast NAM slider.
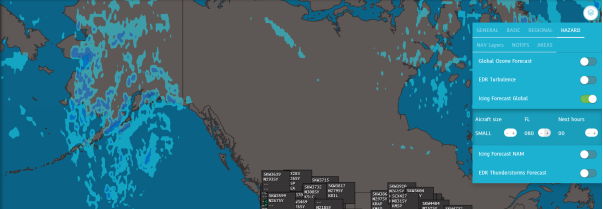
Change the default flight level setting of 010 to 180 and see the differences in the forecast icing conditions.
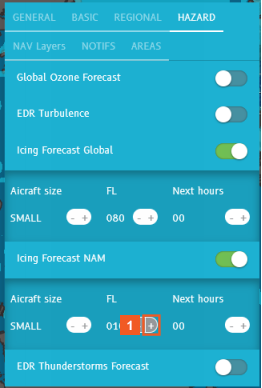
![]() Click the FL + button.
Click the FL + button.
HINT
In your operational environment, you need to click the + button several times to reach FL 180. In this example, we completed those steps for you.
At flight level 180, you can see that the forecast identifies more icing conditions around the southern coast of the United States.
Now, disable the global icing layer to see how the information available to you changes.
![]() Click the Icing Forecast Global slider.
Click the Icing Forecast Global slider.
The icing conditions information for Alaska is associated with the global icing forecast, so that information no longer displays.
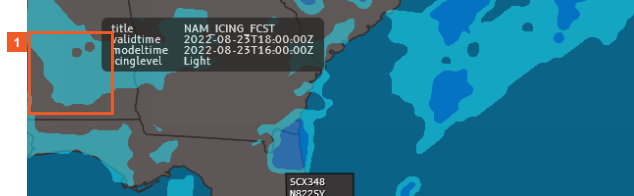
Zoom in and let's look at this icing conditions information in more detail.
![]() Click the Zoom (+) button.
Click the Zoom (+) button.
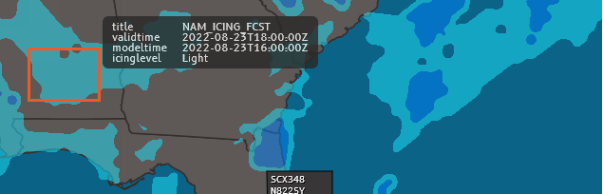
Hover over one of the areas colored darker blue (highlighted in this example). From the on-screen information, you can see that the moderate icing was forecast at 18:00.
As you hover over the lighter blue section (highlighted), you can see that N-Tracking provides similar on-screen text information.
You can also view this information on-screen in a larger format in the Weather pane.
![]() Click the same highlighted area.
Click the same highlighted area.
Close the Weather pane when you finish reviewing the information.
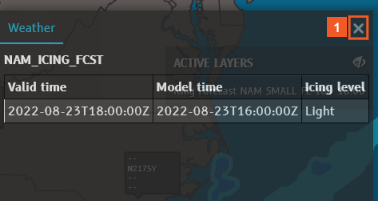
![]() Click the Close button.
Click the Close button.
You have completed your review of the information on the global and North American icing conditions forecast. Next, let's practice using the EDR Thunderstorms Forecast weather layer.
![]() Click the Layers button.
Click the Layers button.
![]() Click the Icing Forecast NAM slider.
Click the Icing Forecast NAM slider.
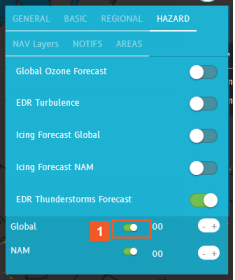
![]() Click the EDR Thunderstorms Forecast slider.
Click the EDR Thunderstorms Forecast slider.
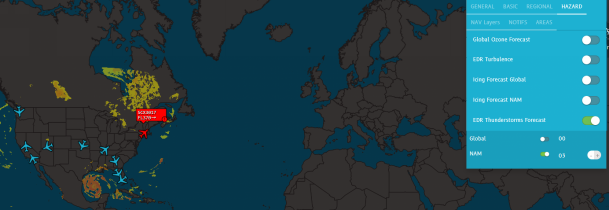
The EDR Thunderstorms Forecast layer displays convective activity and its intensity globally or for North America alone.
View the current Global layer forecast.
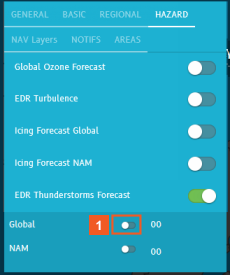
![]() Click the Global slider.
Click the Global slider.
Zoom out to 1000 nm to see more of the map.
![]() Click the Zoom out (-) button.
Click the Zoom out (-) button.
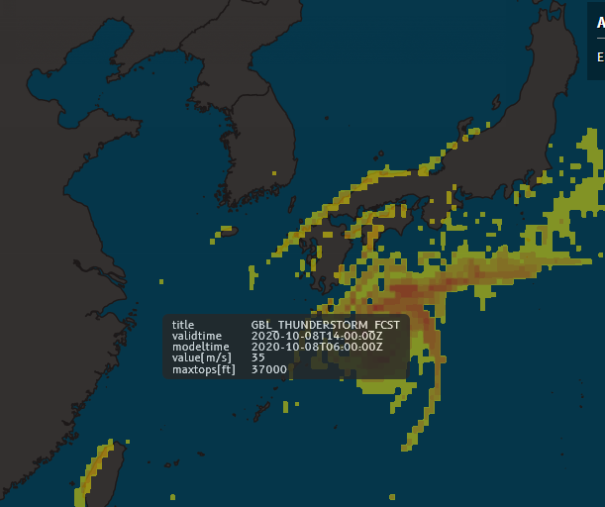
With the map positioned to show Asia and the Pacific Ocean, zoom in and examine the multi-colored area south of Japan (in the Pacific) that represents an area of thunderstorms.
![]() Click the Zoom in (+) button.
Click the Zoom in (+) button.
Hover over the different colors in this depicted area of forecast thunderstorms to learn more about storm intensity.
This chart shows the colors used to depict the intensity of the thunderstorm activity: Areas colored with reds represent the most intense storms.
![]() Click the Zoom out (-) button.
Click the Zoom out (-) button.
For the next part of this example, zoom out again and re-position the map to show North America.
Switch to view the thunderstorm forecast for North America.
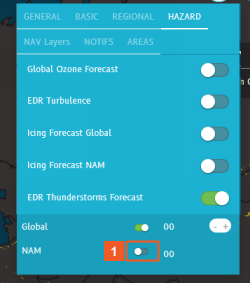
![]() Click the NAM slider.
Click the NAM slider.
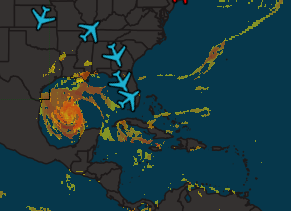
Immediately, you can see convective activity in the Gulf of Florida that was not depicted in the global view.
Disable the Global layer to view the details provided on the NAM layer on its own.
![]() Click the Global slider.
Click the Global slider.
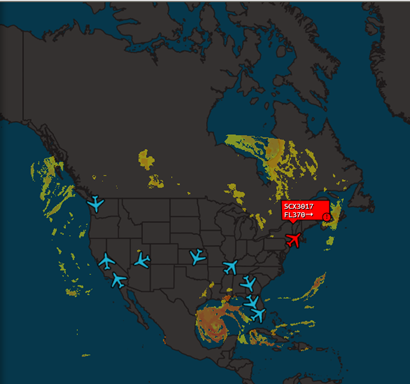
![]() Click the NAM Next hours + button.
Click the NAM Next hours + button.
You can use the Next hours offset control to view the forecast for up to 18 hours in the future.
Three hours from now, the thunderstorm activity may have changed slightly, and you may reassess the impact for the flights you are tracking.
SUCCESS
Congratulations! You have applied the different Weather Hazard Layers to the map and can interpret the information they provide.