Introduction
Display EUMetNet Bulletins, Infrared or Visible Satellite Images, and Global SIGMETs Weather Layers
In this topic, you learn to add the EU MetNet MeteoAlarm bulletins, infrared or visible satellite images, and the global SIGMETs weather layers to the N-Tracking map and interpret the information those layers provide.
We estimate that this will take 10 minutes to complete.
Detailed explanation
Working with Basic Weather Information Available Globally
The Basic Weather Package is the standard global weather package that you receive with an N-Tracking subscription. Infrared and Visible satellite images are available globally, as well as SIGMETs. EUMetNet MeteoAlarm bulletins apply to the European Union only.
SIGMETs
EUMetNet MeteoAlarms
Visible Satellite
After reviewing the Display Basic Weather Information – U.S. Only topic, you learned about several Weather Layers. These layers can be added to the N-Tracking map to help track flights primarily over the United States.
In this topic, you learn about Weather Layers that apply globally, such as Visible and Infrared satellite images and global SIGMETs. You also learn about EUMetNet MeteoAlarm bulletins, which apply only within the European Union.
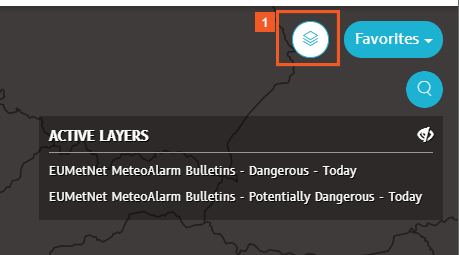
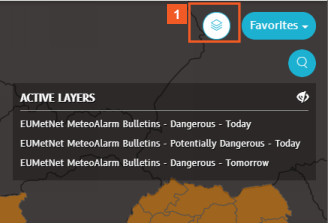
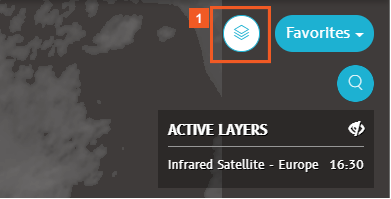
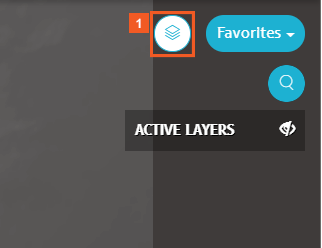
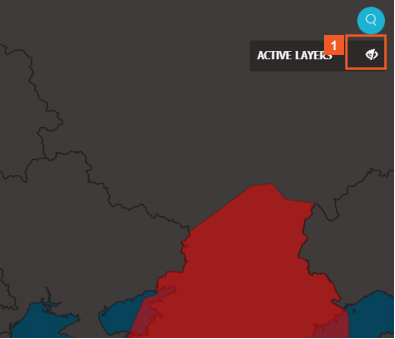
Before you begin your exploration, take note of the ACTIVE LAYERS pane.
You can use this pane to show or hide a list of the weather layers you have active on the map.
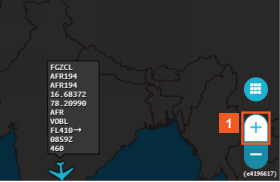
Currently, the map zoom level is 500 nm. To view the areas where EUMetNet bulletins apply, zoom in to 200 nm.
![]() Click Zoom in (+).
Click Zoom in (+).
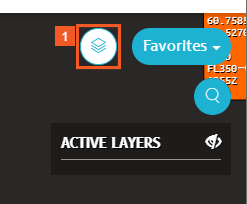
![]() Click the Layers button.
Click the Layers button.
Optionally, adjust the contrast between the land and the water features on the map for better visibility of some of the weather layer features.
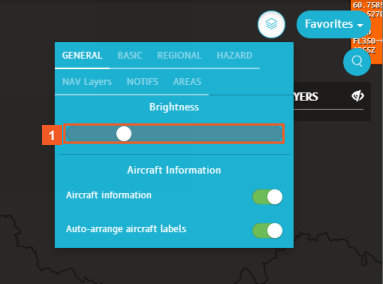
![]() Click the Brightness slider.
Click the Brightness slider.
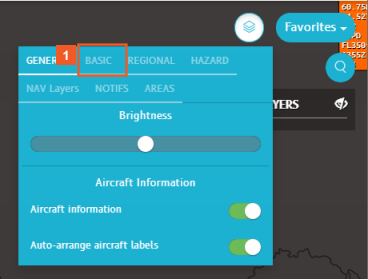
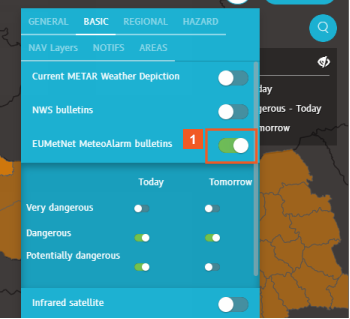
![]() Click the BASIC tab.
Click the BASIC tab.
Enable the EUMetNet MeteoAlarm bulletins weather layer to see the most relevant information on preparing for extreme weather expected to occur somewhere over Europe.
These bulletins alert you to the possible occurrence of severe weather such as:
- heavy rain
- severe thunderstorms
- gale force winds.
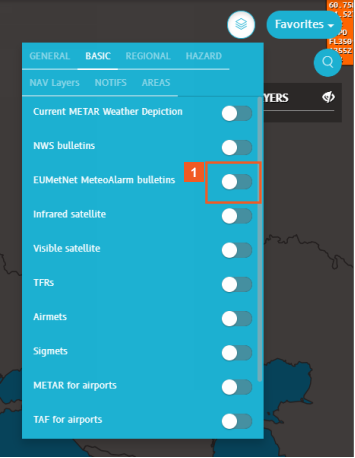
![]() Click the EUMetNet MeteoAlarm bulletins slider.
Click the EUMetNet MeteoAlarm bulletins slider.
The EUMetNet MeteoAlarm bulletins layer expands out to provide options to view hazards for either today or tomorrow.
When you finish viewing the bulletins relevant to your task, you can hide all the sub-layers by clicking the EUMetNet MeteoAlarm bulletins slider.
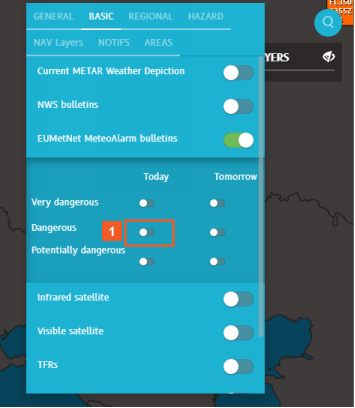
![]() Click the Dangerous (Today) slider.
Click the Dangerous (Today) slider.
You enabled the display for bulletins about dangerous weather.
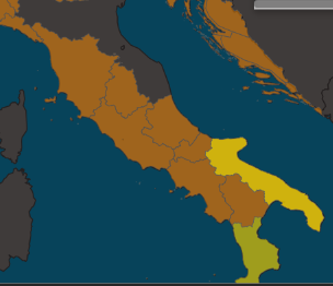
EUMetNet uses orange to indicate zones showing dangerous weather, meaning unusal meteorological phenomena from which damage and casualties are likely to result.
Bulletins about very dangerous weather phenomena display in red. 'Very dangerous' weather means that major damage and accidents are likely.
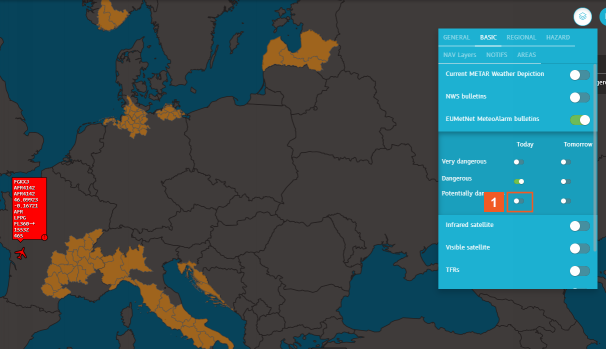
![]() Click the Potentially dangerous (Today) slider.
Click the Potentially dangerous (Today) slider.
EUMetNet uses yellow to indicate potentially dangerous weather conditions. For EUMetNet, typical weather conditions for a region fall into the category of "potentially dangerous".
![]() Click Zoom in (+).
Click Zoom in (+).
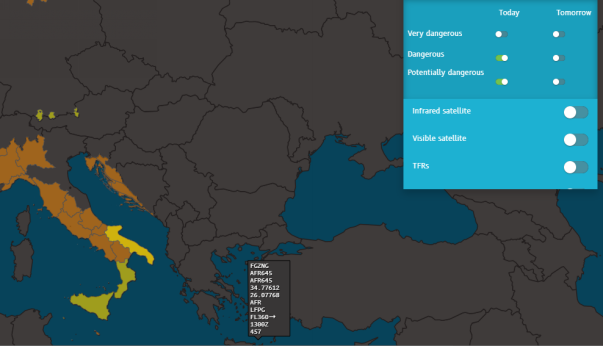
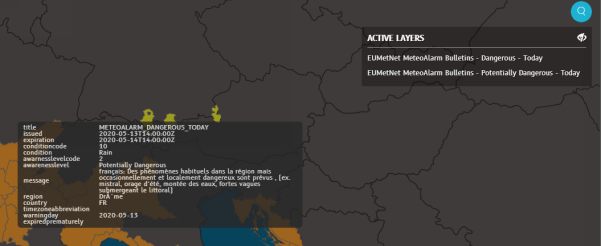
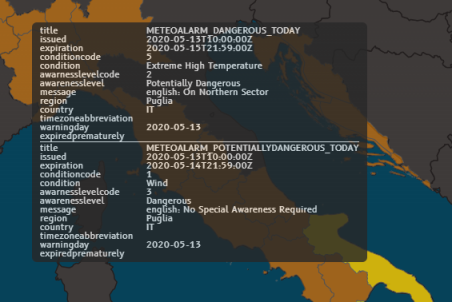
Explore some of these zones, to learn more about the dangers. Hover over an area of interest.
N-Tracking displays details on-screen. For the highlighted area, EUMetNet alerts you to thunderstorms with an awareness level code of 2.
You can see the list of Weather Layers you have enabled in the ACTIVE LAYERS pane.
You can leave the pane open (as shown here) or you can click the Show/Hide icon on the right to use less space on-screen, while still being available for review at the click of a mouse.
When you hover over another region of the map, an EUMetNet alert about potentially dangerous rain displays.
As you'll recall, "potentially dangerous" means weather conditions that are not unusual for the region.
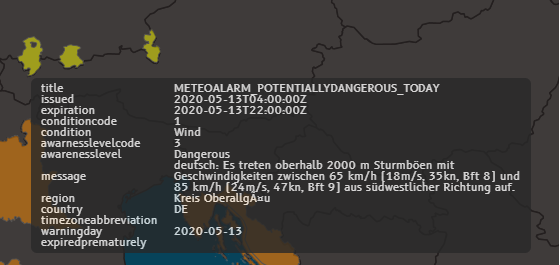
Hover over the yellow shapes in Germany. N-Tracking displays the EU MetNet bulletin about potentially dangerous winds in this area for today.
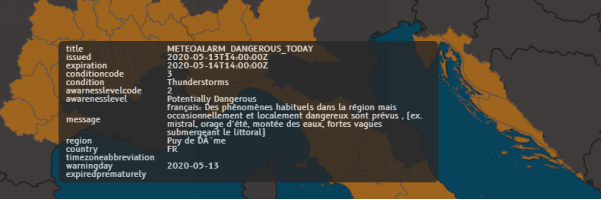
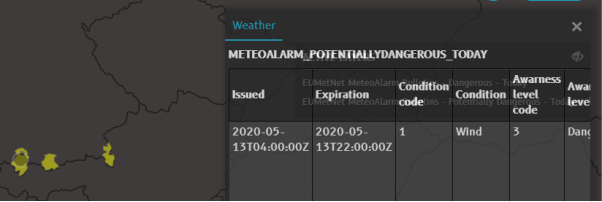
In addition to hovering to display the bulletin on-screen, you can click any of the colored zones to display the same information in the Weather pane on the right of the screen.
For this example, click the yellow shape on the left.
![]() Click the highlighted yellow shape.
Click the highlighted yellow shape.
Scroll right in the Weather pane to see more information.
![]() Click the horizontal scroll bar.
Click the horizontal scroll bar.
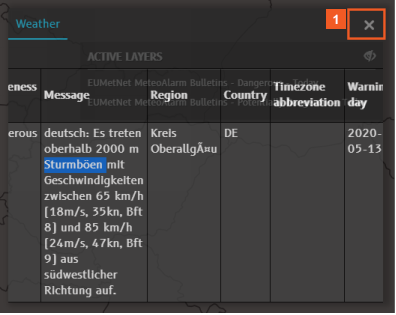
The Message column displays information about the weather hazard (in the language of the affected country).
You can copy this text to your clipboard.
The Region column identifies the affected area.
Close the Weather pane when you have the details you need.
![]() Click Close (X).
Click Close (X).
Hovering over some of the alerts may show you that multiple alerts apply to that area.
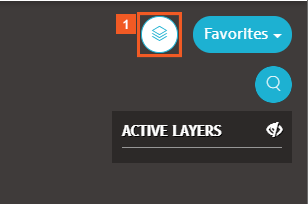
![]() Click the Layers button.
Click the Layers button.
Access the EU MetNet MeteoAlarm bulletins layer again, and see if adding a layer for tomorrow's weather conditions displays more information relevant to your planning.
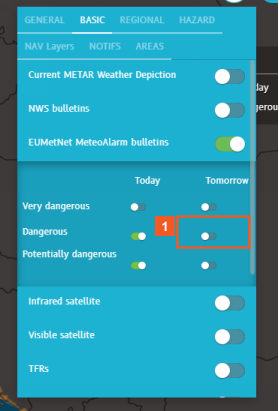
![]() Click the Dangerous (Tomorrow) slider.
Click the Dangerous (Tomorrow) slider.
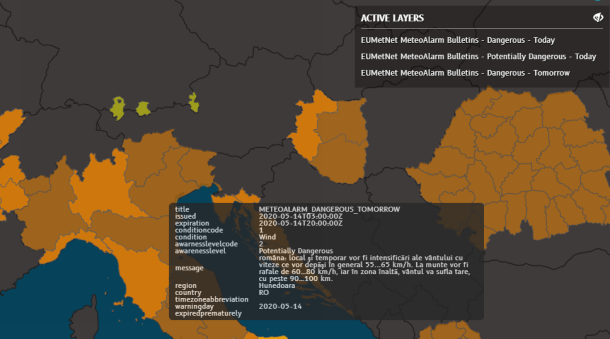
Many other areas have bulletins in effect for tomorrow.
Hover over an affected area and N-Tracking displays the bulletin on-screen. In this example, potentially dangerous winds in the region of Hunedoara display.
![]() Click the Layers button.
Click the Layers button.
You've completed your review of the EUMetNet MeteoAlarm bulletins.
Disable this weather layer by clicking its slider.
![]() Click the EUMetNet MeteoAlarm bulletins slider.
Click the EUMetNet MeteoAlarm bulletins slider.
Next, enable the Infrared satellite image layer and learn how to read the information it adds to the map.
To explore this weather layer, zoom out to 200 nm.
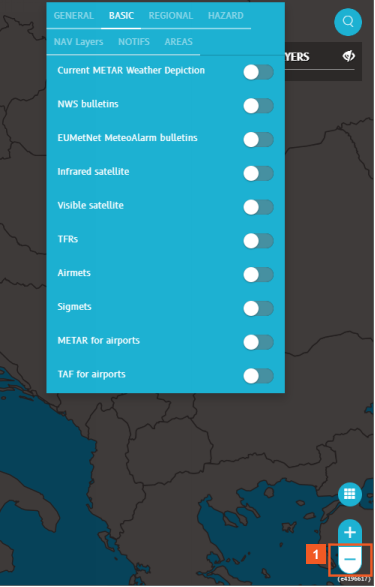
![]() Click Zoom out (-).
Click Zoom out (-).
![]() Click the Layers button.
Click the Layers button.
Infrared satellite images show you the current cloud cover for a selected region. Satellite images update every 30 minutes.
Note: A heat signature is used to create this image.
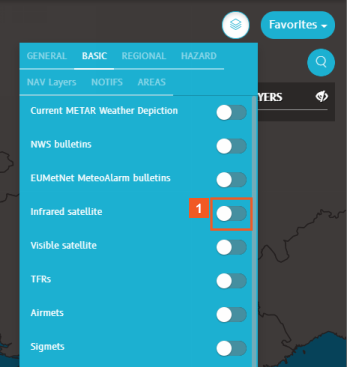
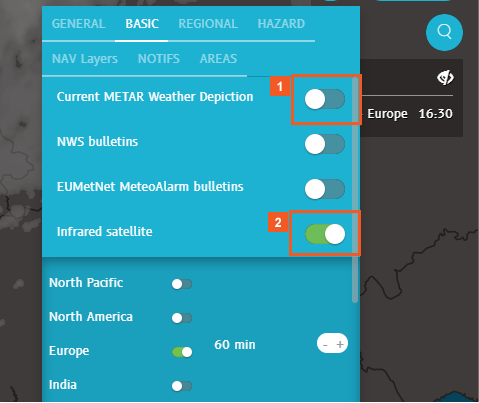
![]() Click the Infrared satellite slider.
Click the Infrared satellite slider.
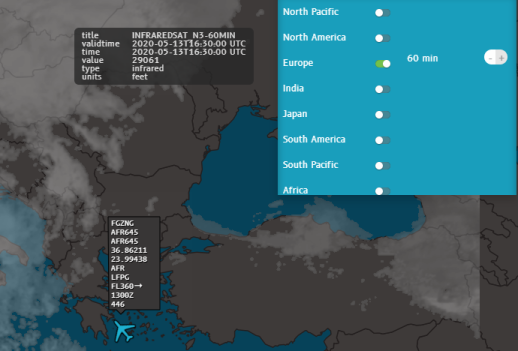
With the Infrared satellite pane open, you can see that images are available for several different regions.
If the flights you're tracking are over the U.S., for example, you would enable the North America layer. For this example, enable the Europe layer.
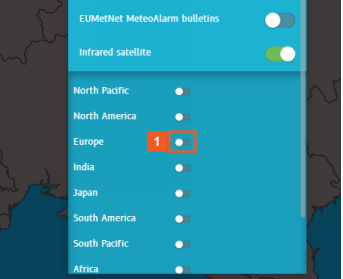
![]() Click the Europe slider.
Click the Europe slider.
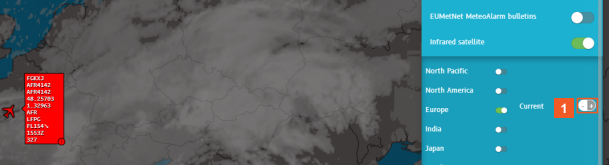
By default, the satellite feed shows current conditions (at 17:30).
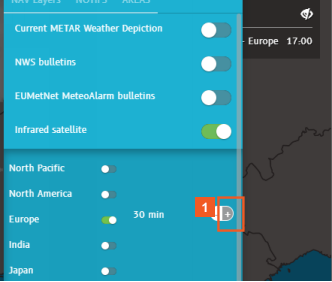
You can use the - and + buttons on the right to show more or less of the satellite feed information. Add 30 minutes and N-Tracking shows satellite information for 30 minutes in the past.
![]() Click the plus (+) button.
Click the plus (+) button.
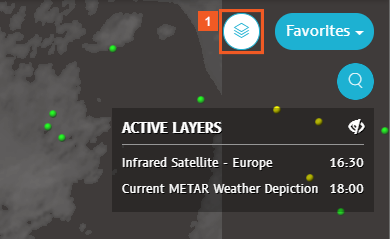
The ACTIVE LAYERS pane also shows the time of the satellite image.
Add another 30 minutes from the satellite image feed (still capturing information before the current time.)
![]() Click the plus (+) button.
Click the plus (+) button.
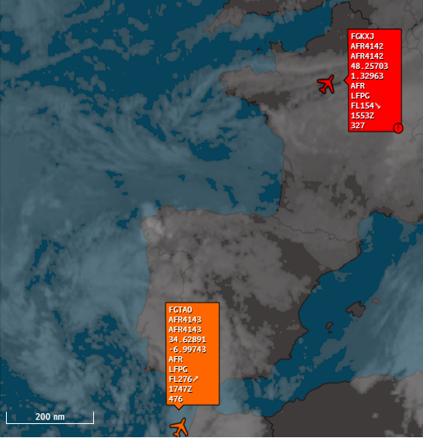
Hover over the area of interest to you. The brighter the white, the higher the cloud.
Position your mouse over the highlighted area, N-Tracking indicates a cloud height of 29,061 feet.
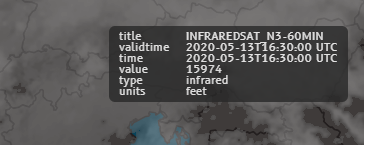
The satellite image is now showing conditions one hour before the current time.
Hover over an area of darker gray and N-Tracking alerts you that cloud height is 15,974 feet.
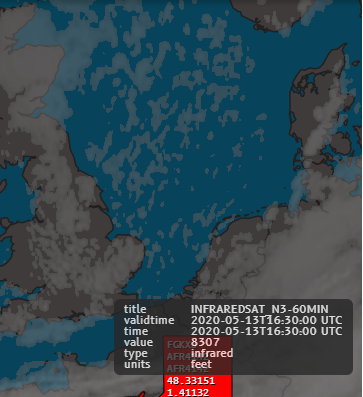
The cloud cover over the south-east coast of England has a cloud height of 8,307 feet.
It might be useful to see airport locations as they relate to this cloud cover. To display this, access Current METAR Weather Depiction in the Layers panel.
For more detailed information on the Current METAR Weather Depiction layer, consult the topic, Display Current METAR, METAR, and TAF for Airports.
![]() Click the Layers button.
Click the Layers button.
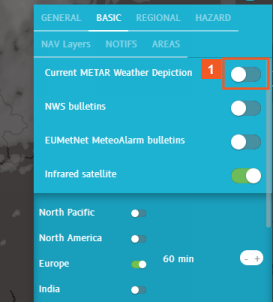
![]() Click the Current METAR Weather Depiction slider.
Click the Current METAR Weather Depiction slider.
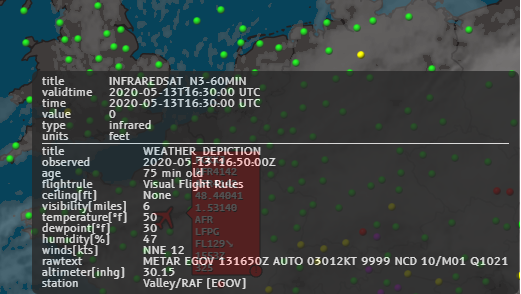
The green dot at the location of the EGOV airport in Holyhead, England indicates that visual flight rules apply. Infrared satellite reports no cloud cover.
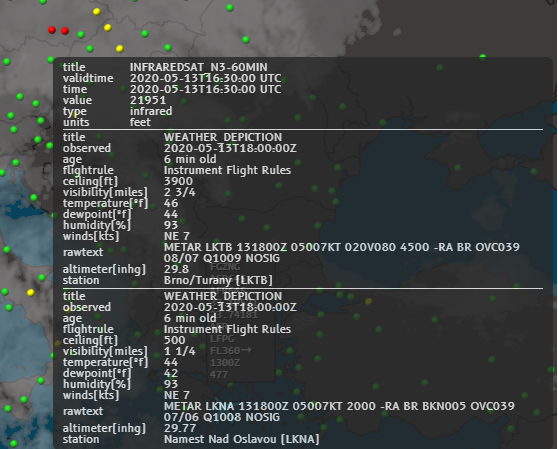
The red METAR dots indicate that Instrument Flight Rules apply at the LKTB and LKNA airports, while infrared satellite reports a cloud height of 21,951 feet in the areas.
![]() Click the Layers button.
Click the Layers button.
SUCCESS
You now know how to enable and work with the Infrared satellite weather layer -- and how to use it in combination with METAR information.
Next, let's enable the Visible satellite weather layer. It works in much the same way.
Disable both of the weather layers you just worked with.
![]() Click the Current METAR Weather Depiction slider.
Click the Current METAR Weather Depiction slider.
![]() Click the Infrared satellite slider.
Click the Infrared satellite slider.
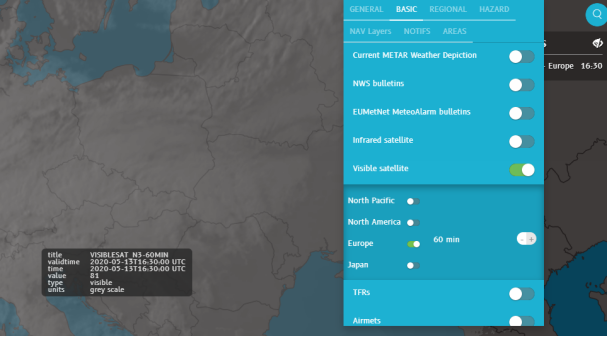
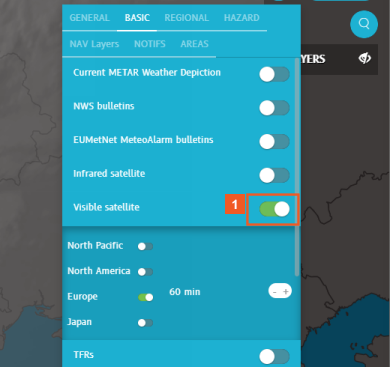
Visible satellite images look very similar to Infrared satellite images.
Note: Visible light are used to produce these images.
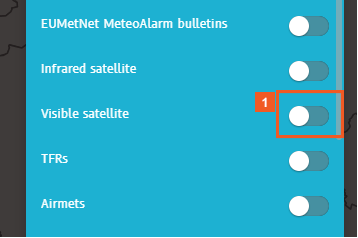
![]() Click the Visible satellite slider.
Click the Visible satellite slider.
As you can see, the Basic Weather Package provides satellite imagery for several regions.
If you are working with flights over the U.S., enable the North America layer.
For this example, enable the Europe layer.
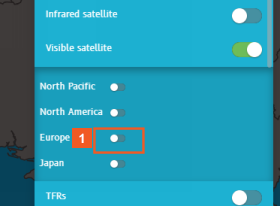
![]() Click the Europe slider.
Click the Europe slider.
Like Visible satellite images, Infrared satellite images let you view current conditions or see how the weather is expected for a certain number of minutes in the future.
You can use the + button to increase the amount of satellite imagery shown by 30-minute increments.
Click the + button to add more of the satellite feed information to the display. After your review, click the - button to revert the image to current or near current conditions.
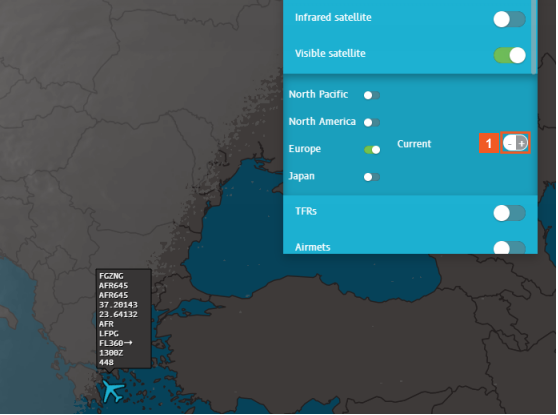
![]() Click the plus (+) button.
Click the plus (+) button.
For this example, the display was backed up by one hour (two clicks of the plus (+) button).
The ACTIVE LAYERS panel reflects the change.
Hover over an area of cloud cover and N-Tracking displays a measure of 81 on the greyscale for cloud height.
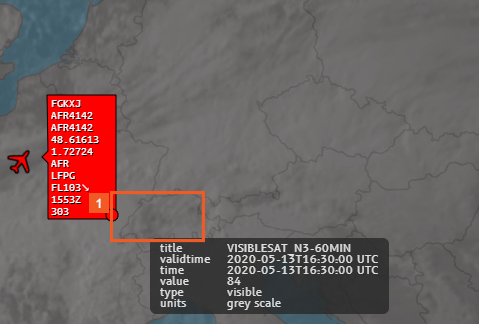
![]() Click the highlighted area.
Click the highlighted area.
N-Tracking displays the same details in the Weather pane. For Visible satellite, the figure 84 in the Value column represents a shade of gray (black is 100 and white is 10). As with Infrared satellite, the brighter the shade of gray (moving towards clear), the higher the cloud ceiling.
Close the Weather pane.
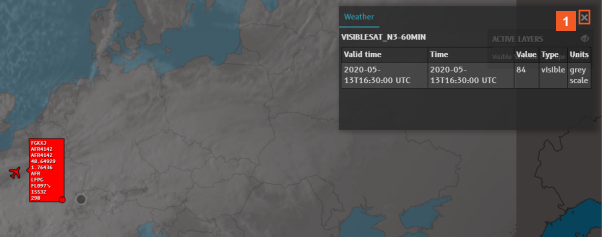
![]() Click Close (X).
Click Close (X).
You now know how to apply the Visible satellite weather layer to the N-Tracking map and how to interpret the information it provides. Let's move on to a different weather layer used for flights around the globe, SIGMETs.
At any time, access the Layers pane to enable or disable Weather Layers. You can choose to hide the list of active weather layers.
Note: Hiding the list does not disable Weather Layers.
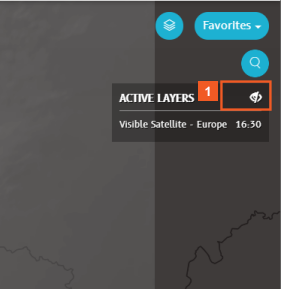
![]() Click the Hide/Show icon.
Click the Hide/Show icon.
![]() Click the Layers button.
Click the Layers button.
Disable the Visible satellite layer -- at the "global" level -- and let's move on to a different Weather Layer -- SIGMETs.
You may need to scroll down to view SIGMETs as it is near the bottom of the pane.
![]() Click the Visible satellite slider.
Click the Visible satellite slider.
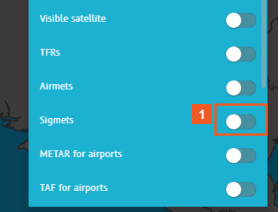
![]() Click the Sigmets slider.
Click the Sigmets slider.
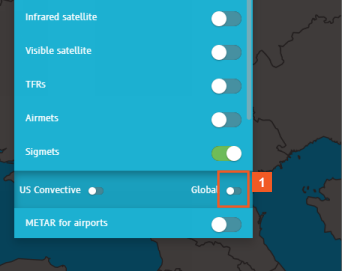
![]() Click the Global slider.
Click the Global slider.
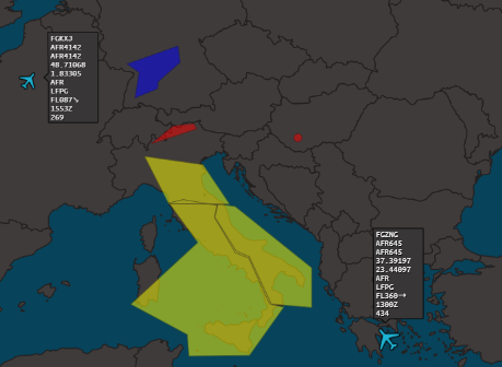
As the name suggests, global SIGMETS provide meteorological information around the globe. The SIGMET issues colored shapes covering FIRs (flight information regions):
- Red indicates thunderstorms
- Yellow indicates turbulence
- Blue indicates icing.
For more details on each, hover over or click the relevant shape displayed on the map.
![]() Click Show/Hide.
Click Show/Hide.
Hover over the NAVY blue SIGMET and review the on-screen information about this weather event.
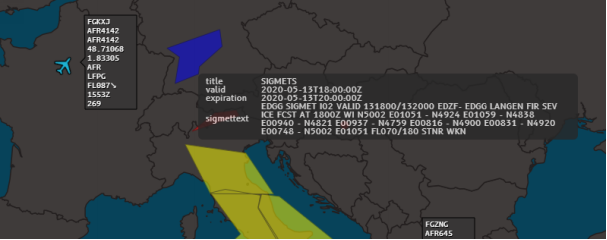
Hover over the yellow SIGMET in the north of Italy and review the information provided.
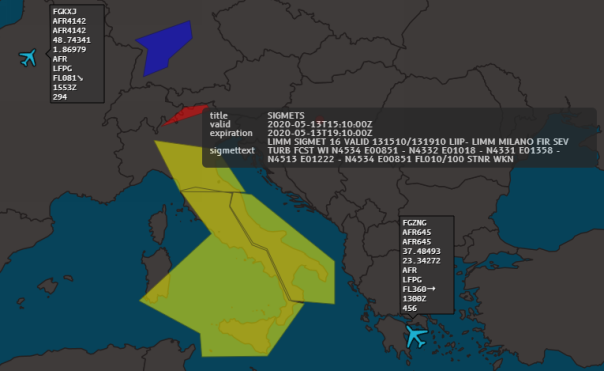
As you have learned while exploring other Weather Layers, clicking a depicted weather phenomenon on the map opens the Weather pane to display the same details.
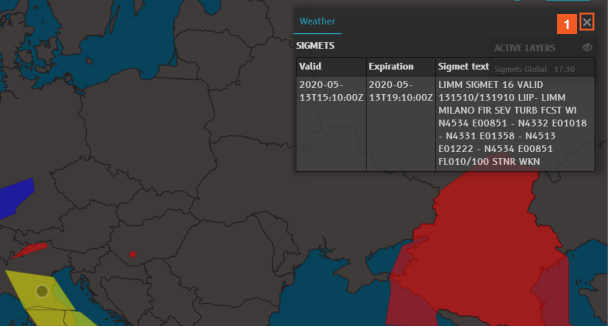
![]() Click Close (X).
Click Close (X).
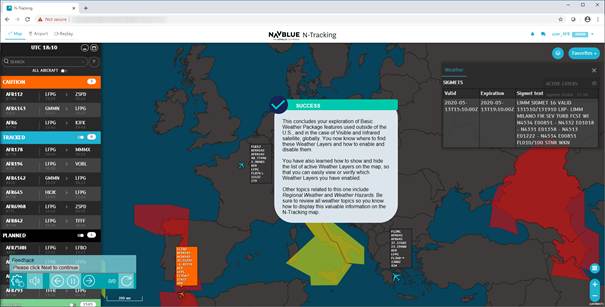
SUCCESS
This concludes your exploration of Basic Weather Package features used outside of the U.S., and in the case of Visible and Infrared satellite, globally. You now know where to find these Weather Layers and how to enable and disable them.
You have also learned how to show and hide the list of active Weather Layers on the map, so that you can easily view or verify which Weather Layers you have enabled.
Other topics related to this one include Regional Weather and Weather Hazards. Be sure to review all weather topics so you know how to display this valuable information on the N-Tracking map.