Introduction
Tropical Forecasts
In this topic you learn how to add tropical forecast information to the map and how to interpret the display.
We estimate that this will take 6 minutes to complete.
Detailed explanation
Introduction
Use the Tropical forecasts section of the REGIONAL weather tab to view more detailed information about hurricanes, cyclones, and tropical storms in the areas you are tracking and planning flights.
SCENARIO: The American National Hurricane Center has put out a message about tropical storm Isaias.
The storm is forecast to produce heavy rains over Puerto Rico, the Dominican Republic, northern Haiti, the Bahamas, and Southern Florida, and then track North.
Rainfall and wind hazards are expected to extend well beyond the center of the system.
Enable the Tropical forecasts weather layer to view updated information on for hurricanes, cyclones, and tropical storms.
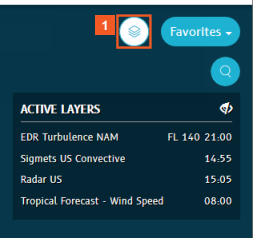
In this example, you have already enabled several weather layers, including American radar images.
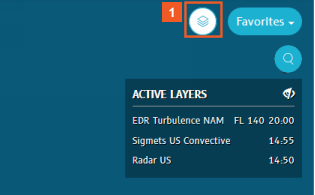
![]() Click the Layers button.
Click the Layers button.
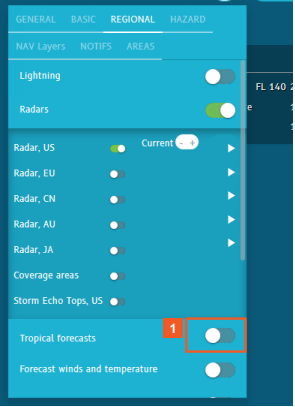
![]() Click the Tropical forecasts slider.
Click the Tropical forecasts slider.
Use the different layers within the Tropical forecasts group to display different storm characteristics.
Start by enabling all model tracks to see the tracks for a given storm. Tropical storm Isaias is over Haiti, the Dominican Republic and heading for the coast of Florida.
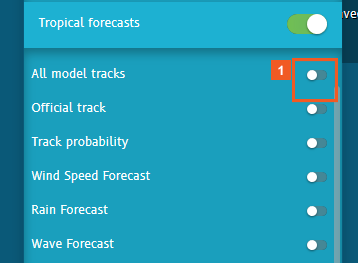
![]() Click the All model tracks slider.
Click the All model tracks slider.
Storm tracks display best against darker backgrounds. Adjust the Brightness slider on the GENERAL tab.
![]() Click the GENERAL tab.
Click the GENERAL tab.
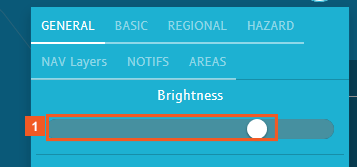
![]() Click the Brightness slider.
Click the Brightness slider.
Click on the left side of the slider to darken the water color.
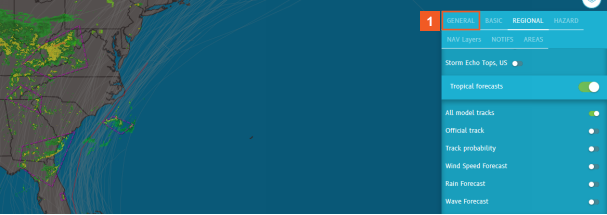
You can now see the model tracks more easily. The lines represent the forecast track of storms based on different models.
- The gray lines represent the track of the storm predicted by various models.
- The red line represents the official track.
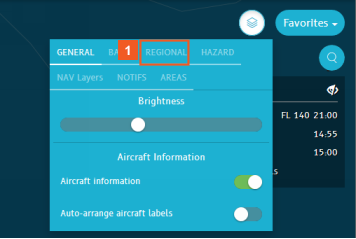
![]() Click the REGIONAL tab.
Click the REGIONAL tab.
HINT
You can hover over any of the grey tracks to see the model name. Additionally, zooming in creates some separation, therefore it's easier to view. Note: Users may have a preferred model based on their past experience.
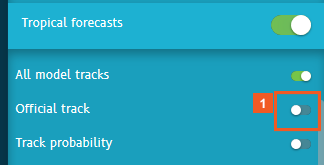
![]() Click the Official track slider.
Click the Official track slider.
The Official track layer displays all past positions of the storm (shown by the small red dots) and provides a good view of where the storm has been and the direction in which it is moving. This data is updated every six hours or more frequently, as needed.
Symbols used for the track:![]() tropical storm
tropical storm
![]() hurricane
hurricane
![]() tropical depression
tropical depression
![]() past position
past position
As you have seen with other weather features, you can hover over the track or click anywhere on the track to view more details on-screen or in the Weather pane.
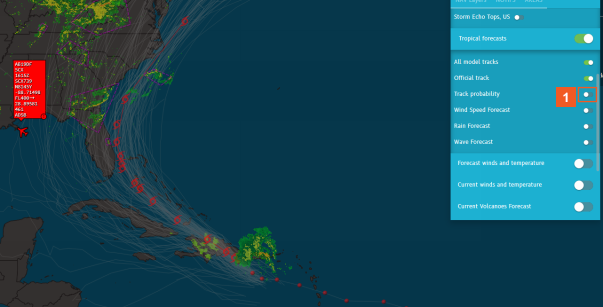
![]() Click the Track probability slider.
Click the Track probability slider.
The different colors in the graph indicate different levels of probability.
Hover over the center, reddish storm probability band. You can see details, such as the storm name (Isaias) and its ID.
The probability for the storm to be present in the red zone is high.
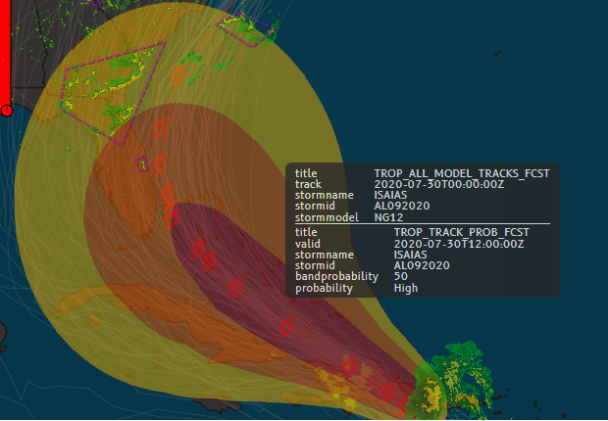
Hover over another highlighted area, this one in the outer, yellowish band.
The probability of the storm traveling into this zone is currently low.
Disable the first three sliders before you move on to explore the Wind Speed Forecast.
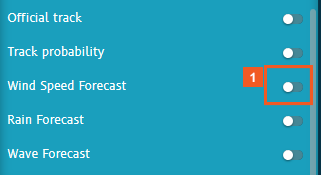
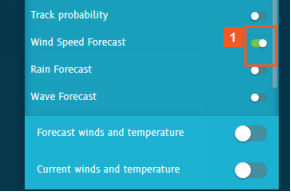
![]() Click the Wind Speed Forecast slider.
Click the Wind Speed Forecast slider.
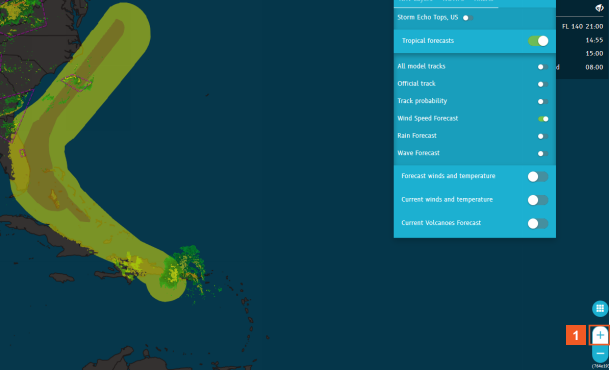
You can see the wind speed forecast shown in yellow. (The color is greenish over (blue) areas of water.)
Standard colors used for mapping wind speed (in knots) include:
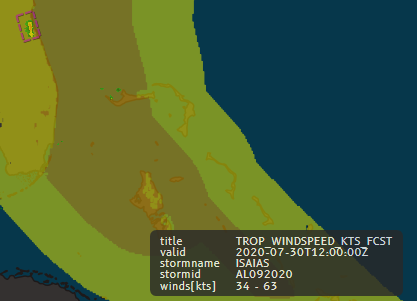
Hover over the wind diagram or click within it to view detailed information.
Zoom in for better visibility on the islands affected by the storm winds.
![]() Click the Zoom in (+) button.
Click the Zoom in (+) button.
Hover over the highlighted area of the green outer band. The on-screen information tells you that wind speed is 33 knots.
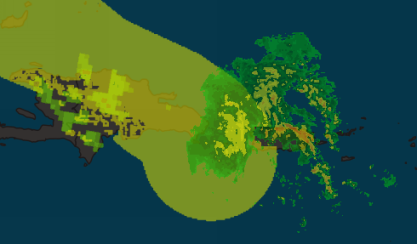
Hover over the central, caramel-colored band and you can see that the wind speed in the zone depicted in this color is higher, between 34 and 63 knots.
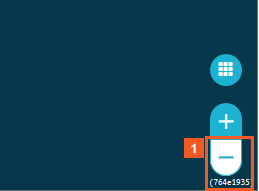
Zoom out again to a zoom level of 200 nm.
![]() Click the Zoom out (-) button.
Click the Zoom out (-) button.
![]() Click the Layers button.
Click the Layers button.
Disable the Wind Speed Forecast layer before you explore the Rain Forecast layer.
![]() Click the Wind Speed Forecast slider.
Click the Wind Speed Forecast slider.
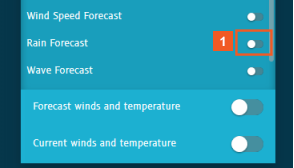
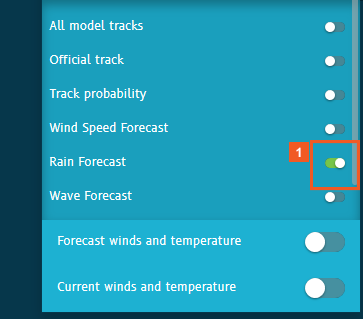
![]() Click the Rain Forecast slider.
Click the Rain Forecast slider.
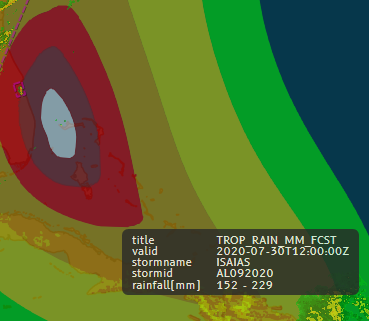
You are now displaying a color-coded, contoured forecast of rain data values over both land and water areas.
The standard codes used to depict rainfall are: Note: This chart uses inches. N-Tracking uses the same color scheme and associates them with the equivalent millimeters of precipitation.
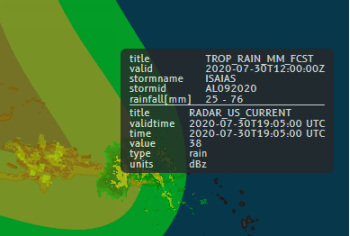
Hover over the dark red band near the center of the colored shape.
N-Tracking provides the details that rainfall for this zone is forecast at 152-229 mm.
Hover over the outer green band.
In contrast, rainfall for the zone depicted in this color is estimated at 25 mm.
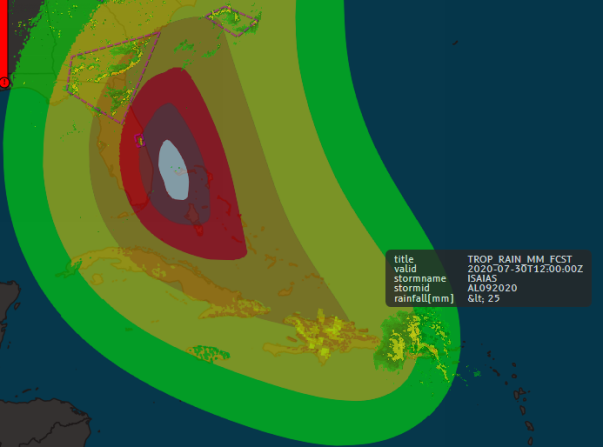
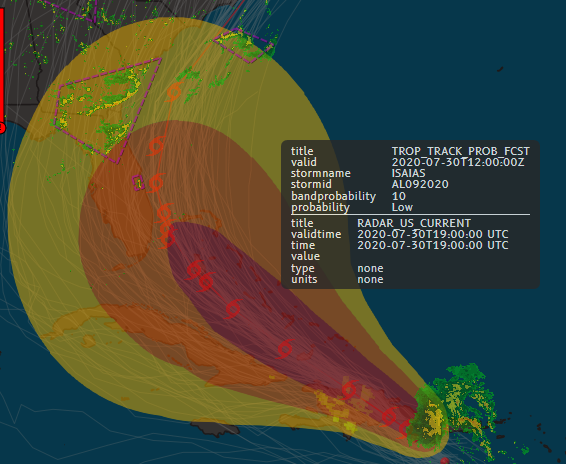
If you hover over a region for which radar images are also available, N-Tracking displays details for both Weather Layers.
Disable the Rain Forecast layer before you move on to the last layer in this group.
![]() Click the Rain Forecast slider.
Click the Rain Forecast slider.
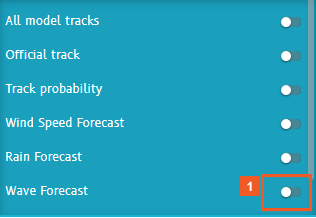
![]() Click the Wave Forecast slider.
Click the Wave Forecast slider.
The color coding shows the height of the waves in feet.
The standard colors used for the graph include: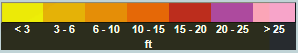
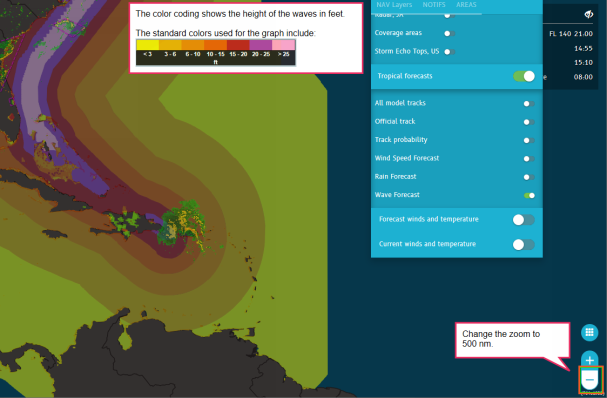
Change the zoom to 500 nm.
![]() Click the Zoom out (-) button.
Click the Zoom out (-) button.
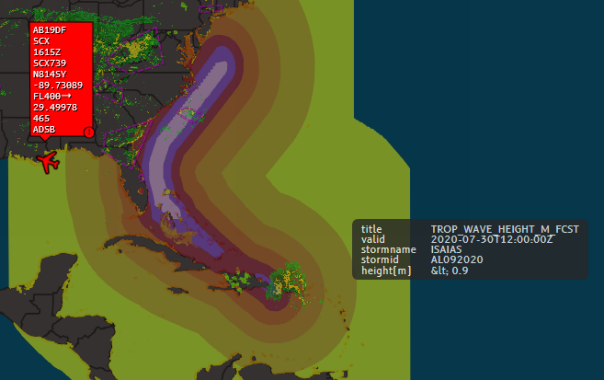
The Wave Forecast layer works exactly like the other weather layers that use different colors to depict different intensity of the weather phenomenon you're looking at. If you hover your mouse over the outer green zone, the wave height associated with tropical storm Isaias shows as 0.9 meters.
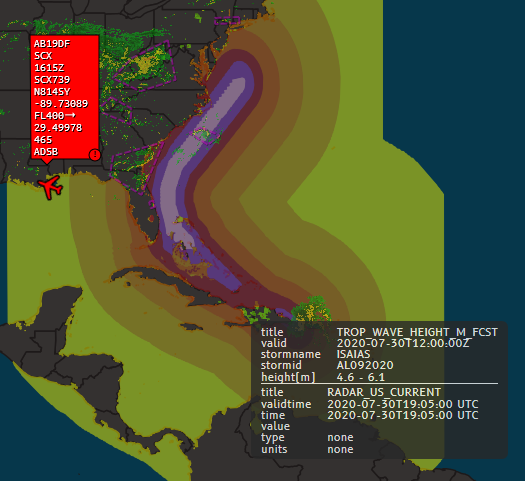
Hover over the reddish zone nearer the center of the shape, and you see that wave height is forecast at 4.6 to 6.1 meters.
SUCCESS
Congratulations! You have successfully worked with the weather layers that focus on tropical weather phenomena. Use them as needed in your flight monitoring tasks.
For information on depicting other regional weather phenomena on the map, consult the related topics.